FARM TO COLLEGE
We are doing some big renovations to the dashboard this year! We will be adding new data soon for K-12 schools, hospitals, and colleges. In the meantime you can view data from our 2018 campus dining survey below.
REGION AT-A-GLANCE
ABOUT OUR DATA
FINE has recently launched the New England Farm & Sea to Campus Data Center, a one stop shop for campuses to share data and generate reports with a new public-facing dashboard. Stay tuned as we integrate this Metrics Dashboard with the Data Center.
This page uses data from FINE’s 2018 Farm to College Survey (see detailed report here). The 32-question survey was a follow-up to a survey of campuses completed by FINE in 2015. The 2015 survey sought to identify farm to institution trends across colleges and universities in the region; the resulting report established a baseline for New England college procurement of local food in 2014-15. In order to measure the progress of New England colleges, the 2018 survey asked many of the same questions as the first survey. It also asks additional questions about tracking local foods, regional food definitions, training and technical assistance needs, and the relationship between dining services and campus food pantry programs.
The survey was sent to 200 colleges in New England with dining services and 110 responded to the survey, a 55% response rate. The participating colleges in 2018 accounted for 70% (or 534,130 undergraduates) of the undergraduate enrollment among the 200 colleges.
The original survey tool and the clean raw data will be available for download soon. Please note that this data is self-reported and may conflict with other data sources.
CAMPUS DINING REPORT
KEY INDICATORS
Local Food Spending by State
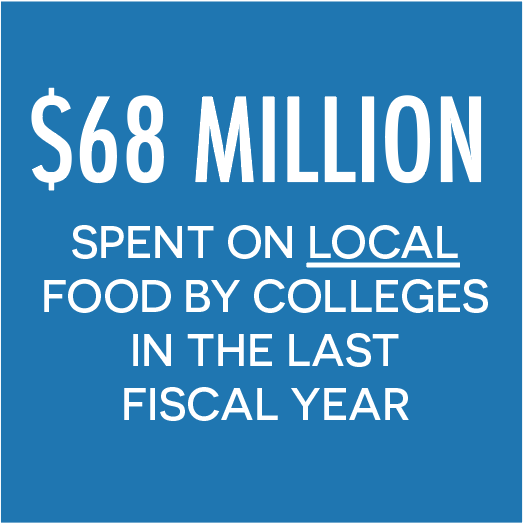
The total amount spent on food by responding colleges, along with the average percentage of total budget spent on local food, vary widely among the New England states. While Massachusetts and Connecticut colleges spent, on average, a much lower proportion of their food budget on local food than colleges in many of the other states, they accounted for more than two thirds of the total local food purchases made by participating New England colleges over the last fiscal year.
Sourcing Local Food Products
Approximately half of the responding colleges reported procuring local products directly from at least one producer or producer cooperative, including fishers/ fishing cooperatives. On average, colleges reported procuring local food directly from 6.8 producers, and approximately two producer cooperatives, which represent multiple producers.
Campuses are Self-Operated and Managed by Food Service Management Companies
27% of campuses are self-operated while 73% are managed by a food service management company (FSMC). Of the 73% who are managed by a FSMC, 26% use Sodexo, 16% use Chartwells, and 6% use Bon Appetit and Aramark.
How Colleges Define Local
The most prominent definitions of “local” reported by responding colleges are food that has been raised, grown, or harvested within 250 miles, within 150 miles, and within the six New England states. Colleges with self-operated dining services were more likely to use 250 miles than those run by FSMCs while colleges with dining services operated by FSMCs were more likely to use the 150 mile definition than self-operated colleges.
How New England Colleges Track Local Purchases
Responding colleges use a variety of tools to track their local food purchases including distributor reports, in-house customized spreadsheets or tools, and an FSMC tracking tool
Top Products Colleges are Sourcing Locally
Colleges were asked about the percentage of specific food product categories sourced locally. Colleges reported that an average of 55.5% of their dairy and milk was sourced locally. Other food products sourced locally in high percentages include seafood, vegetables, and eggs
Top barriers to purchasing local products
When asked to list the biggest challenges faced in procuring local food, cost, year-round availability, overall availability of local foods, and fulfilling volume needs were mentioned by the highest number of respondents. The top nine challenges are listed below and the full list can be found in the report.
Products that are most difficult to source locally
Survey respondents were asked to list the top five local products that were most difficult to source for their college. As in the last survey undertaken in 2015 (where respondents were asked a different question that examined the same idea), meat and meat products, whether poultry, pork or beef, are at the top of the list of local products that dining services have found difficulty sourcing locally. The top nine products that respondents found difficult to source are listed below and the full list is available in the report.
Campus Farms and Gardens
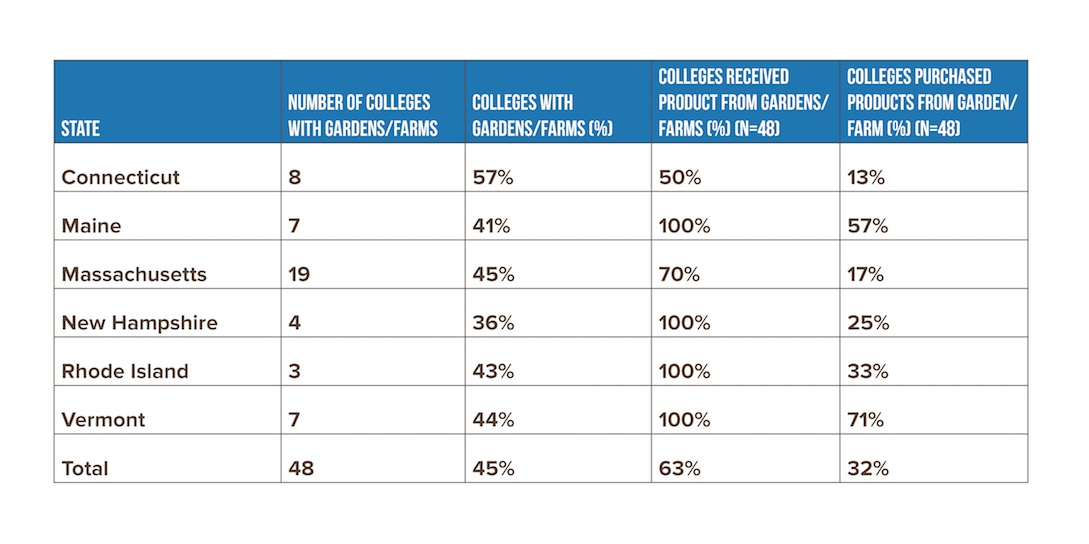
Overall, 45% of the participating colleges reported that their campus has a campus garden or farm (Table 5). Of those colleges that had a garden or farm, 63% utilized at least some amount of produce from the garden or farm in dining services, and close to a third (32%) reported purchasing the products from the campus farm or garden.


