

FOOD DISTRIBUTION
REGION AT-A-GLANCE


ABOUT OUR DATA
This page uses data from the Farm to Institution New England and Health Care Without Harm’s joint 2015 survey of New England food distributors. This 21-question survey collected data regarding characteristics of New England food distributors, including sales to institutions and barriers to purchasing local foods. The survey was sent to 87 distributors and 56 responded to the survey, a 64% response rate.
While data from 56 distributors was collected, the following information is based on responses from the 28 distributors who sell to institutions. The original survey tool and the clean raw data are available for download on our data sources page. Please note that this data is self-reported and may conflict with other data sources.
FOOD DISTRIBUTION REPORT
In August 2016, we released a research report titled "Getting it There: The Role of New England Food Distributors in Providing Local Food to Institutions." This report is one in a series of reports designed to help food system stakeholders understand the impact of institutional markets on New England's food system.

KEY INDICATORS
Larger Distributors are More Likely to Sell to Institutions
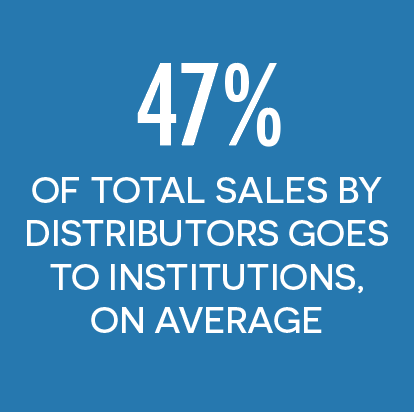
New England distributors sold to an average of 81 K-12 schools, 45 colleges, and 54 hospitals. Distributors with gross sales greater than $10 million made a greater portion of their sales from institutions than other distributors.
Distributors with over $10 million in gross sales reported that institutional sales represented nearly half (48%) of their gross sales. This contrasted with institutional sales proportions from respondents with gross sales between $1 and $10 million (11%) and less than $1 million (28%). This suggests that larger distributors count institutional sales more as a core part of their services than smaller distributors

Distributors Buy Food from Many Local Producers
Vendors usually sell their products to more than one distributor. Taking this into account, our respondents reported that they procured their local products from an average of 46 producers, two local farmer cooperatives (which represent multiple farmers), and eight local processors.
In total, respondents sourced from over 1,100 producers, 40 local farmer cooperatives, and 186 processors.

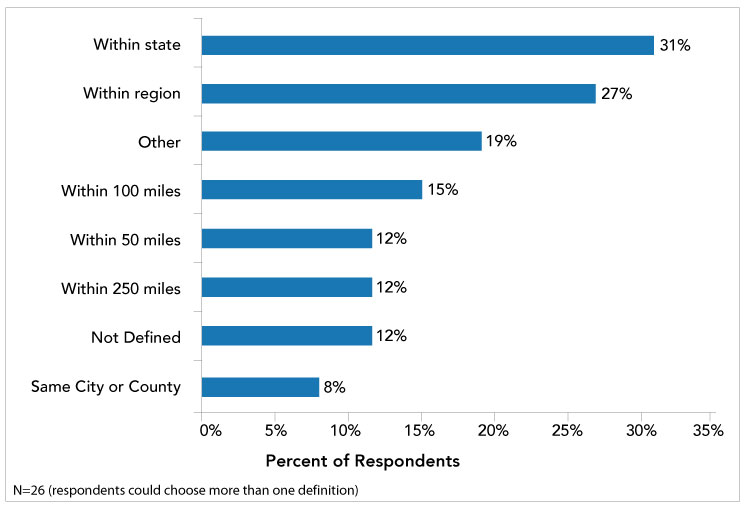
Distributors Define "Local" in Different Ways
All respondents who sell to institutions reported that they promote at least some of their products as “local,” though the definition of local varied significantly.
The most common definitions of “local” were products that were “produced within the state” or “produced within the region”
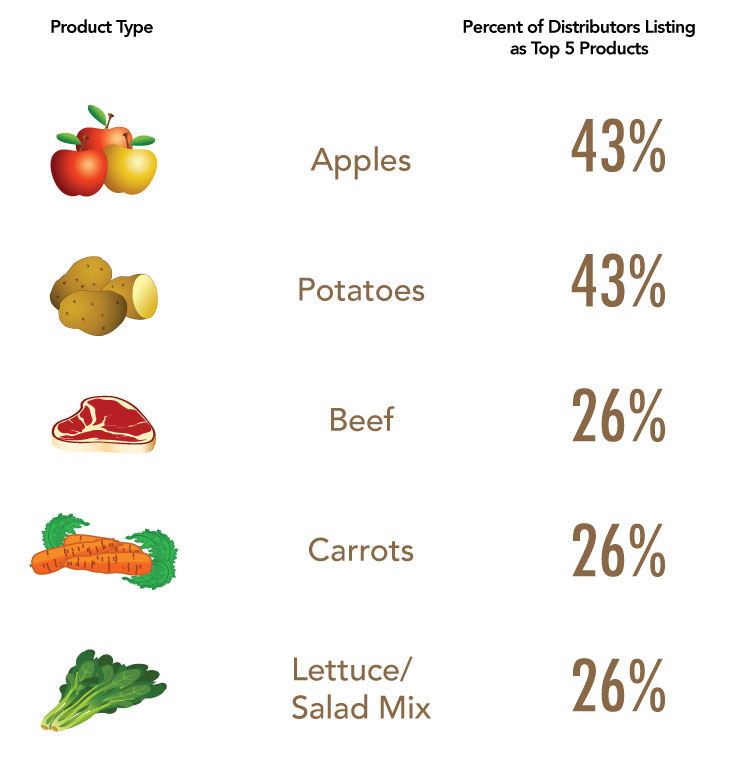
Distributors Sell Lots of Apples & Potatoes to Institutions
Almost half of the surveyed distributors listed apples and potatoes in the top five local food products sold to institutions. Other products often listed in the top 5 included beef, carrots, and greens.
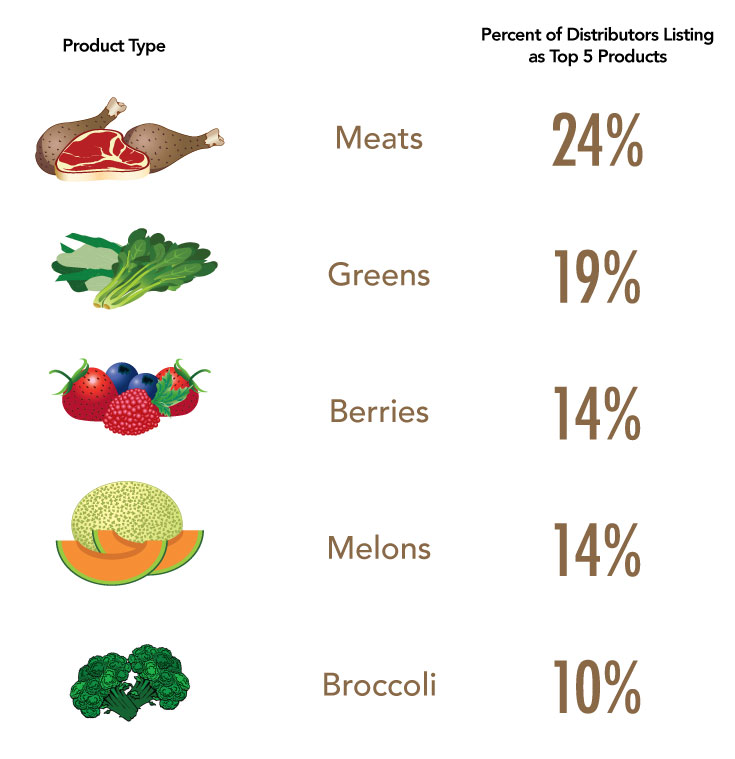
Supply of Meat, Greens, Berries, Melons, and Broccoli is Not Meeting Institutional Demand
When asked to list the top local products where institutional customer demand was greater than supply, one-third of the surveyed distributors responded that this was not an issue.
The products listed most frequently where institutional demand was greater than supply are displayed below.
Consistent Supply & High Price Point are the Two Biggest Obstacles to Selling More Local Food
Institutions often face challenges when they seek to procure local foods. This survey provided an opportunity for respondents to comment on key challenges and limitations with procuring and/or selling local products.
The two biggest obstacles reported by distributors were the lack of consistent, year-round supply of local products and the high price point of local products for their customers.

Local Food as a Percent of Total Sales Goes Down as Distributor Size Increases
Distributors with less than $1 million in sales reported that their local product sales accounted for nearly all of their gross sales. Distributors with gross sales between $1 million and $10 million also reported a high proportion of local product sales. However, for distributors with gross sales greater than $10 million, local product sales accounted for significantly less of their gross sales.
This suggests that smaller New England distributors have a greater emphasis on selling local products, while larger companies are likely serving as full-service providers with a mix of local and non-local products.
